Since you seldom hear anything from Project Runeberg, you might have concluded that we’re dead now. But this is wrong. Even though less books are added, we still have people actively proofreading the pages we scanned before. Compared to PGDP.net, our system is more wiki-like (less workflow oriented) and our volunteer proofreaders can jump to any page they like, resulting in fewer completed books.
Just like a Wiki, we have a page listing the recent changes, http://runeberg.org/rc.pl
This page is generated by a little Perl script, that reads a log file, where our proofreading script adds a line each time a page is proofread. Other scripts (upload, metadata updates, etc.) also write their changes to the same log.
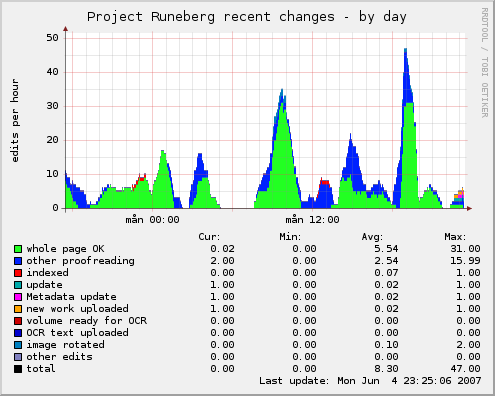
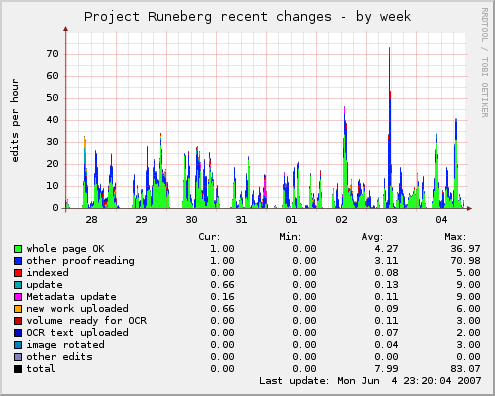
Since our webserver runs Debian Linux, it was very easy to install “Munin”, a free software for system performance diagrams. And it was also easy to write a Munin plugin that reads our recent changes log file, displaying the number of edits per hour, each category of changes having its own color.


Click here to view ALL of the Munin Graphs
As you can see, we average 4 whole pages per hour over the last week, and 3 minor edits per hour. This week also seem to have 0.1 new works (scanned and) uploaded per hour, which isn’t too bad.
Between midnight and 6 AM (local Swedish time) there is almost no activity.
The traditional Munin graphs display the performance and usage of our server’s components: processor, RAM, disk, network bandwidth, Click here to view graphs
Old UNIX sysadmins will recognize Munin as an “MRTG” replacement.
More information about Munin is found here.
PGDP.net of course has it’s own system for graphs, showing activity per user and team.
Lars Aronsson (lars@aronsson.se)
Project Runeberg – free Nordic literature